Page 3 of 7
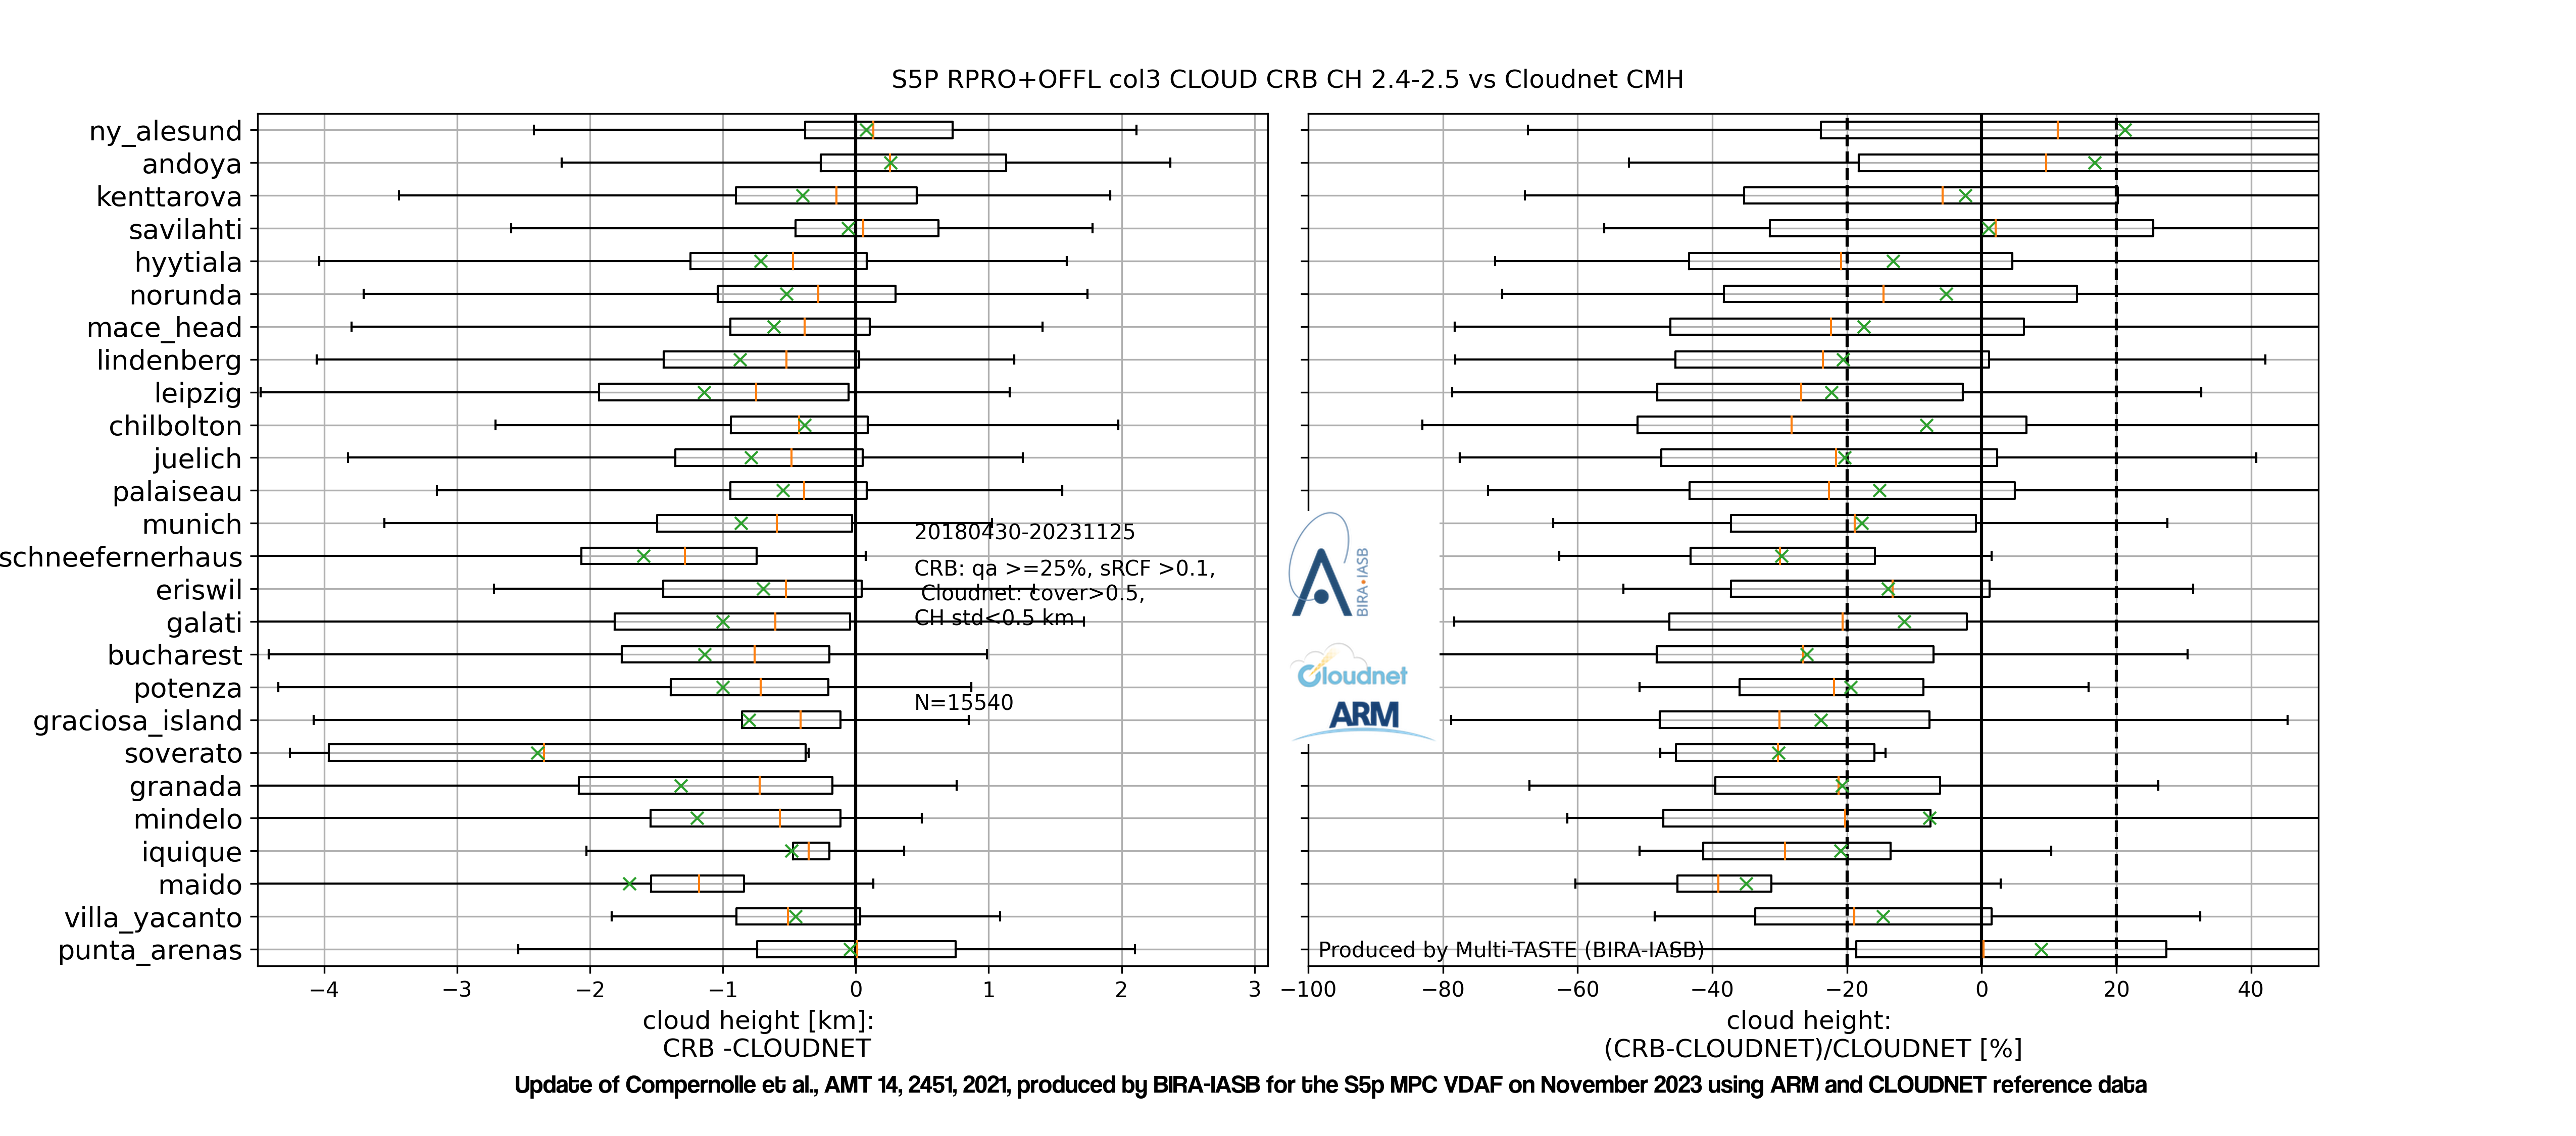
The graph below shows boxplots of the difference (left) and relative difference (right) between TROPOMI ROCINN_CRB cloud height and CLOUDNET cloud mean height. (© Update March, 2023, of Compernolle et al., AMT 2021). Stations are ordered by latitude. Box edges: first and third quartile; line: median; whiskers: 5 and 95 percentiles; cross: mean.