Validation Summary
The Sentinel-5p TROPOMI L2_O3_TCL data (CCD) are in good overall agreement with correlative ground-based measurements (SHADOZ ozonesonde) and with EOS-Aura OMI, Metop-B GOME-2 and Metop-C GOME-2 satellite data. Bias and dispersion estimates meet mission requirements (<25 %).
| Product ID | Stream | Product | Version | Orbits | Bias | Dispersion | Special features |
|---|---|---|---|---|---|---|---|
| L2_O3_TCL | OFFL/RPRO | CCD | 02.04.01 02.05.00 |
2867-current | +19 % +3.7 DU |
25 % 4.6 DU |
|
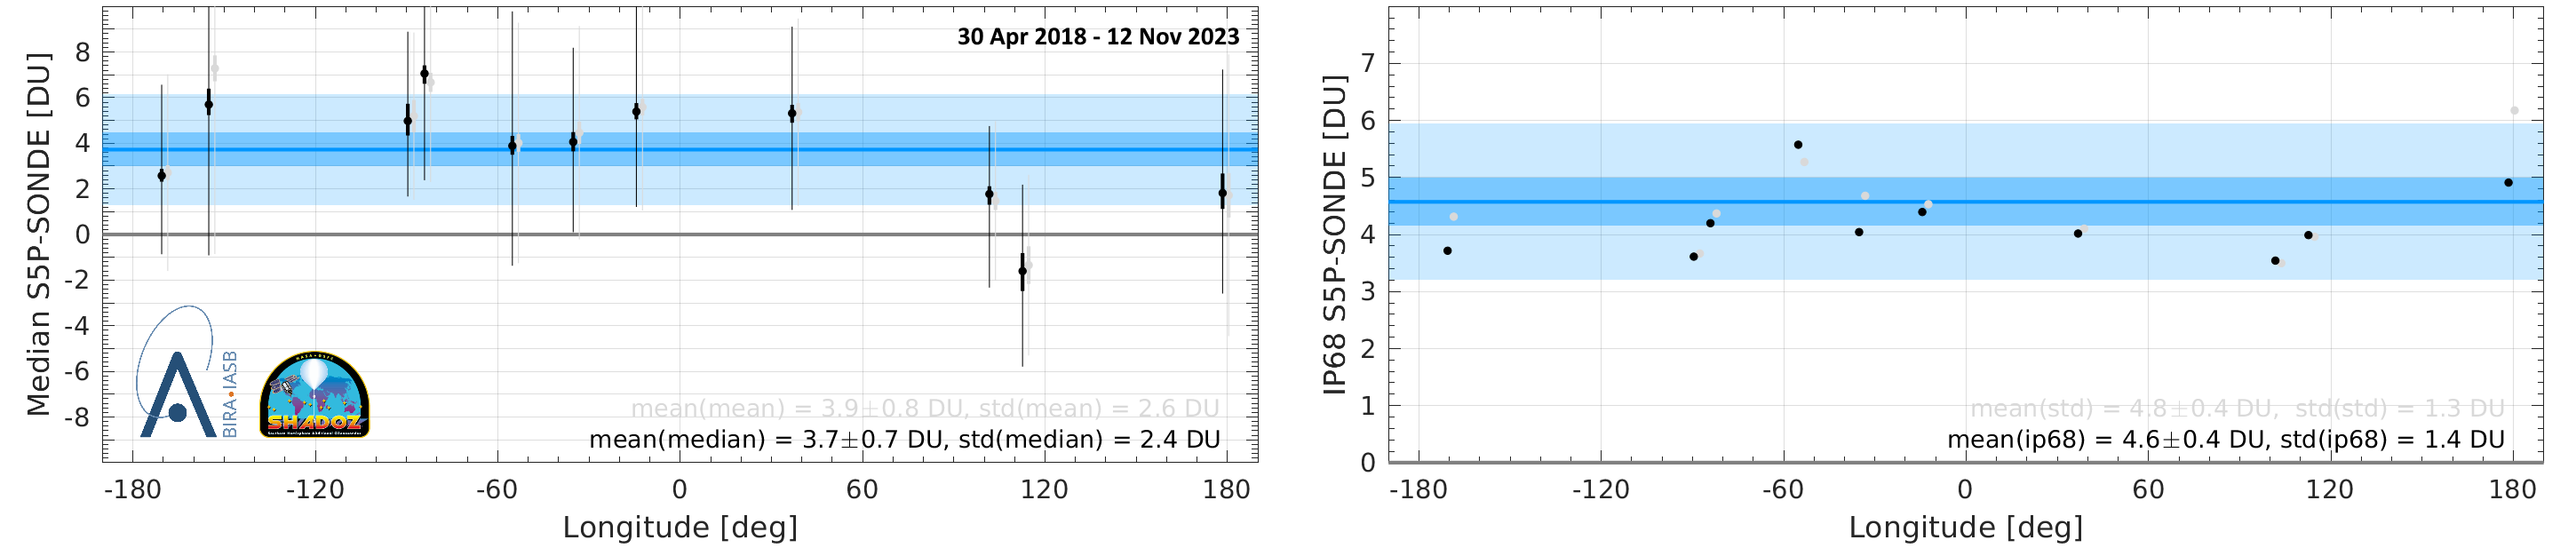
The graphs below display the latest estimates of TROPOMI tropospheric O3 column data quality obtained from comparisons to ozonesonde. Shown are the median value (left) and the dispersion (right, 68% interpercentile) of the absolute difference TROPOMI minus ozonesonde, at each SHADOZ site (marker) in the 20o S - 20o N tropical belt. The blue line and light blue shade indicate the mean value and the standard deviation of the sample of station estimates for the SHADOZ network.
A detailed description of the method and a comprehensive discussion of validation results can be found in the Quarterly Validation Report #21: April 2018 - November 2023.
Validation Method
TROPOMI tropospheric O3 data are obtained using the Convective Cloud Differential technique, which results in a daily, gridded measurement for the tropical belt (0.5o latitude by 1.0o longitude). Each TROPOMI measurement represents the 3-day average of the O3 column between the surface and 270 hPa under cloud-free conditions.
The operational MPC VDAF validation data stream includes comparisons of Sentinel-5p data to co-located measurements by ozonesondes. The ozone profiles at high vertical resolution acquired by these sondes are screened, then integrated over the same vertical domain as the TROPOMI product (surface to 270 hPa) prior to comparison. Additional intercomparisons of TROPOMI to other satellite sensors (EOS-Aura OMI, MetOp-B GOME-2) are regularly conducted by the MPC team as well.
Details on the methodology and results are described in Hubert et al. (2021).
References
- Hubert, D. et al., TROPOMI tropospheric ozone column data: geophysical assessment and comparison to ozonesondes, GOME-2B and OMI, Atmos. Meas. Tech., 14, 7405–7433, doi:10.5194/amt-14-7405-2021, 2021.
Validation Data
Correlative measurements used as reference for satellite validation are collected by ozonesondes operated in the framework of the Southern Hemisphere ADditional OZonesondes network (SHADOZ). Currently eleven SHADOZ stations provide reference data over the 20o S - 20o N belt over which the TROPOMI CCD data products are available.
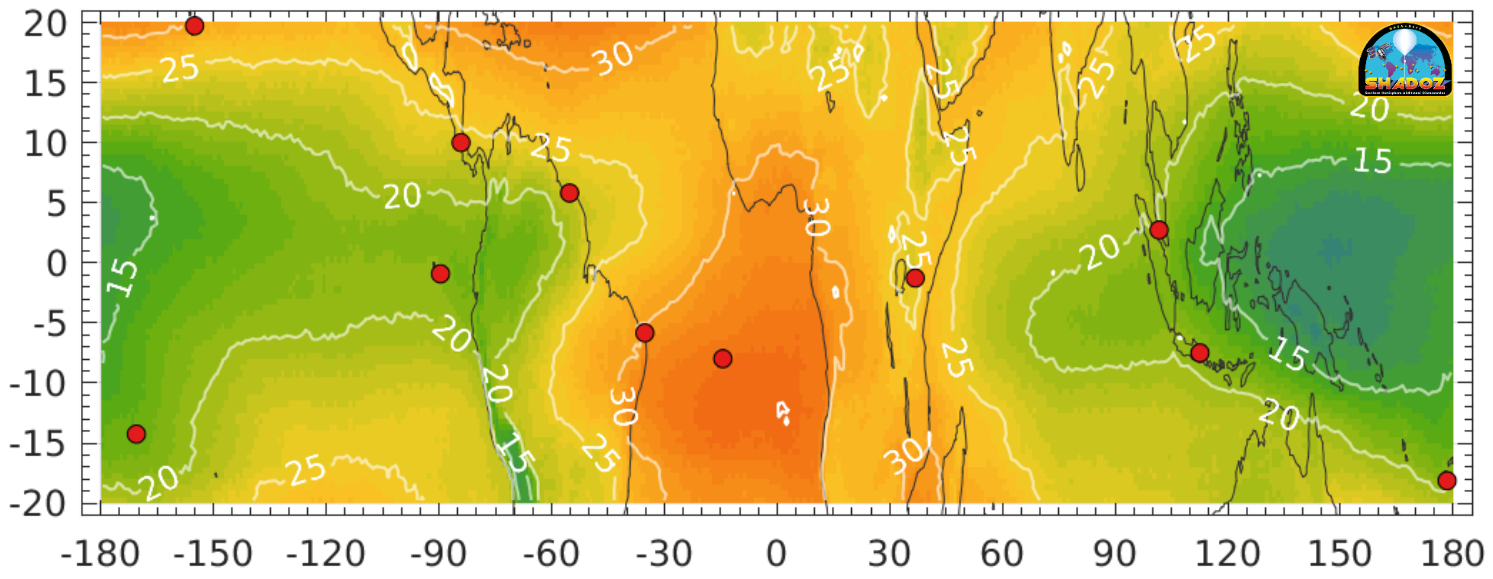
Location of the eleven ozonesonde stations (red markers) contributing correlative measurements to the validation of Sentinel-5p. The background map shows the 5-year median tropospheric O3 column field (DU) as measured by TROPOMI between May 2018 and April 2023.
Correlative data are obtained via the following channels :
- the SHADOZ data archive (Version 6, R.M. Stauffer, A.M. Thompson and D.E. Kollonige),
- the rapid delivery data from the NOAA (B.J. Johnson) and KNMI (A. Piters) data archives,
- the NDACC Data Host Facility, mirrored at EVDC and in BIRA-IASB's CORR-2 database for validation purposes.
References
- Hubert, D. et al., TROPOMI tropospheric ozone column data: geophysical assessment and comparison to ozonesondes, GOME-2B and OMI, Atmos. Meas. Tech., 14, 7405–7433, doi:10.5194/amt-14-7405-2021, 2021.
- Sterling, C. W. et al., Homogenizing and estimating the uncertainty in NOAA’s long-term vertical ozone profile records measured with the electrochemical concentration cell ozonesonde, Atmos. Meas. Tech., 11, 3661–3687, doi:10.5194/amt-11-3661-2018, 2018.
- Tarasick, D. W., et al., Improving ECC ozonesonde data quality: Assessment of current methods and outstanding issues, Earth Space Sci., 8, e2019EA000914. doi:10.1029/2019EA000914, 2021.
- Thompson, A. M. et al., First reprocessing of Southern Hemisphere Additional Ozonesondes (SHADOZ) ozone profiles (1998–2016): 2. Comparisons with satellites and ground‐based instruments. J. Geophys. Res. Atmos., 122, 13,000-13,025, doi:10.1002/2017JD027406, 2017.
- Thompson, A. M. et al., Ozonesonde Quality Assurance: The JOSIE–SHADOZ (2017) Experience, Bull. Am. Meteorol. Soc., 100, 155-171, doi:10.1175/BAMS-D-17-0311.1, 2019.
- Witte, J. C. et al., First Reprocessing of Southern Hemisphere ADditional OZonesondes Profile Records: 3. Uncertainty in Ozone Profile and Total Column, J. Geophys. Res. Atmos., 123, 3243-3268, doi:10.1002/2017JD027791, 2018.
VDAf Validation Server
The Sentinel-5p Mission Performance Centre provides an operational validation service relying on the VDAF Automated Validation Server (VDAF-AVS). This fully automated data analysis system collects correlative measurements from quality-controlled monitoring networks and compares them to Sentinel-5p data using community endorsed protocols. It outputs a suite of traceable quality indicators enabling users to judge the fitness-for-purpose of the Sentinel-5p data.
The figure below illustrates the automated comparison of Sentinel-5p tropospheric O3 column data (CCD) with respect to correlative measurements acquired by an ozonesonde of the SHADOZ Network. More tropospheric O3 validation results are available at http://mpc-vdaf-server.tropomi.eu/o3-tcl
The VDAF Automated Validation Server in brief:
- hosted at BIRA-IASB and operated with s[&]t,
- provides routine validation for the ESA/Copernicus Sentinel-5p Mission Performance Centre,
- ingests correlative measurements from the ESA Atmospheric Validation Data Centre (EVDC) hosted at NILU, collected from ESA's Fiducial Reference Measurements (FRM) programme and from ground-based monitoring networks contributing to WMO's Global Atmosphere Watch,
- builds on heritage from the Multi-TASTE satellite validation system, the QA4ECV validation server (EC FP7 QA4ECV project) and the CAMS NDACC validation server (EC FP7 NORS project),
- is co-funded by ESA and the Belgian Science Policy Office (BELSPO) as a contribution to the Copernicus Space Component.
Latest Issue
Quarterly Validation Report of the Copernicus Sentinel-5 Precursor Operational Data Products #21: April 2018 - November 2023
Archive
Previous issues of the quarterly validation report are archived here.