Validation Summary
The Sentinel-5p TROPOMI L2_AER_LH (OFFL) data product shows a very good agreement with two other satellite aerosol layer height estimates, from MISR (stereoscopic imagery) and CALIOP (active lidar sensing of the aerosol vertical distribution). Early TROPOMI AER_LH showed a systematic difference with MISR aerosol plume height of about 600 m (lower for TROPOMI). This is mostly due to the difference in the sensitivity of the instruments and the differences in the algorithms. A difference of about 500 m (lower for CALIOP) is expected from simulations, TROPOMI ALH being sensitive to the centroid aerosol layer height. For very thick plumes the difference between TROPOMI ALH and CALIOP layer height even decreases to only 50 m. This is well within the requirements of 100 hPa for the bias.
The TROPOMI ALH dispersion is large due to cloud contamination and surface effects. With rigorous cloud screening, 50 % of the pixels are already within 1 km of the CALIOP weighted extinction height. Accounting for the expected bias, this is within the requirements of 50 hPa. Cloud screening is performed with high spatial-resolution SNPP/VIIRS cloud fractions. Since SNPP is expected to be decomissioned within the next year, a new cloud mask was created, based on a machine-learning technique that simulates VIIRS-like cloud masks, based on FRESCO cloud parameters, that are available from TROPOMI data directly. FRESCO cloud screening is already used in the NRTI stream. There is a reasonable performance of the cloud mask compared to the original VIIRS cloud mask and a clear improvement compared to the FRESCO cloud mask. The new cloud mask will replace the current cloud mask in both the NRTO and OFFL stream, making the cloud screening more consistent and allowing for operation beyond the lifetime of SNPP.
A limitation of the TROPOMI ALH product has become apparent following the severe bushfires in New South Wales during the 2019-2020 fire season, which produced very high altitude smoke plumes (altitude > 20 km). These heights were not anticipated and ALH values are limited to about 13 km altitude. An update to include these very high altitudes is foreseen for the next near, before the reprocessing of the entire mission planned for 2027.
Because of the degradation of the UVAI, the applied UVAI filter for the ALH retrievals removes currently a large number of observations, which are in principle well suited for ALH retrievals.
Validation methodology
The validation of TROPOMI L2_AER_LH data relies on comparisons with other satellite observations and ground-based lidar measurements. From satellite observations, the stereoscopic plume height product from MISR and to the weighted extinction height provided by CALIOP were used in the early years of the mission. The ALH has been active updated using new insights and techniques, steadily increasing its accuracy, especially over land surfaces. The validation of the data was shifted to lidar measurements from space (ATLID on EarthCARE) and ground-based lidars from EARLINET. The average difference between weighted extinction height and ALH decreased from approximately − 1.9 to −0.9 km over land and from approximately −0.8 to +0.1 km over ocean for selected cases. Continuous monitoring with ATLID confirms the overall improvement.
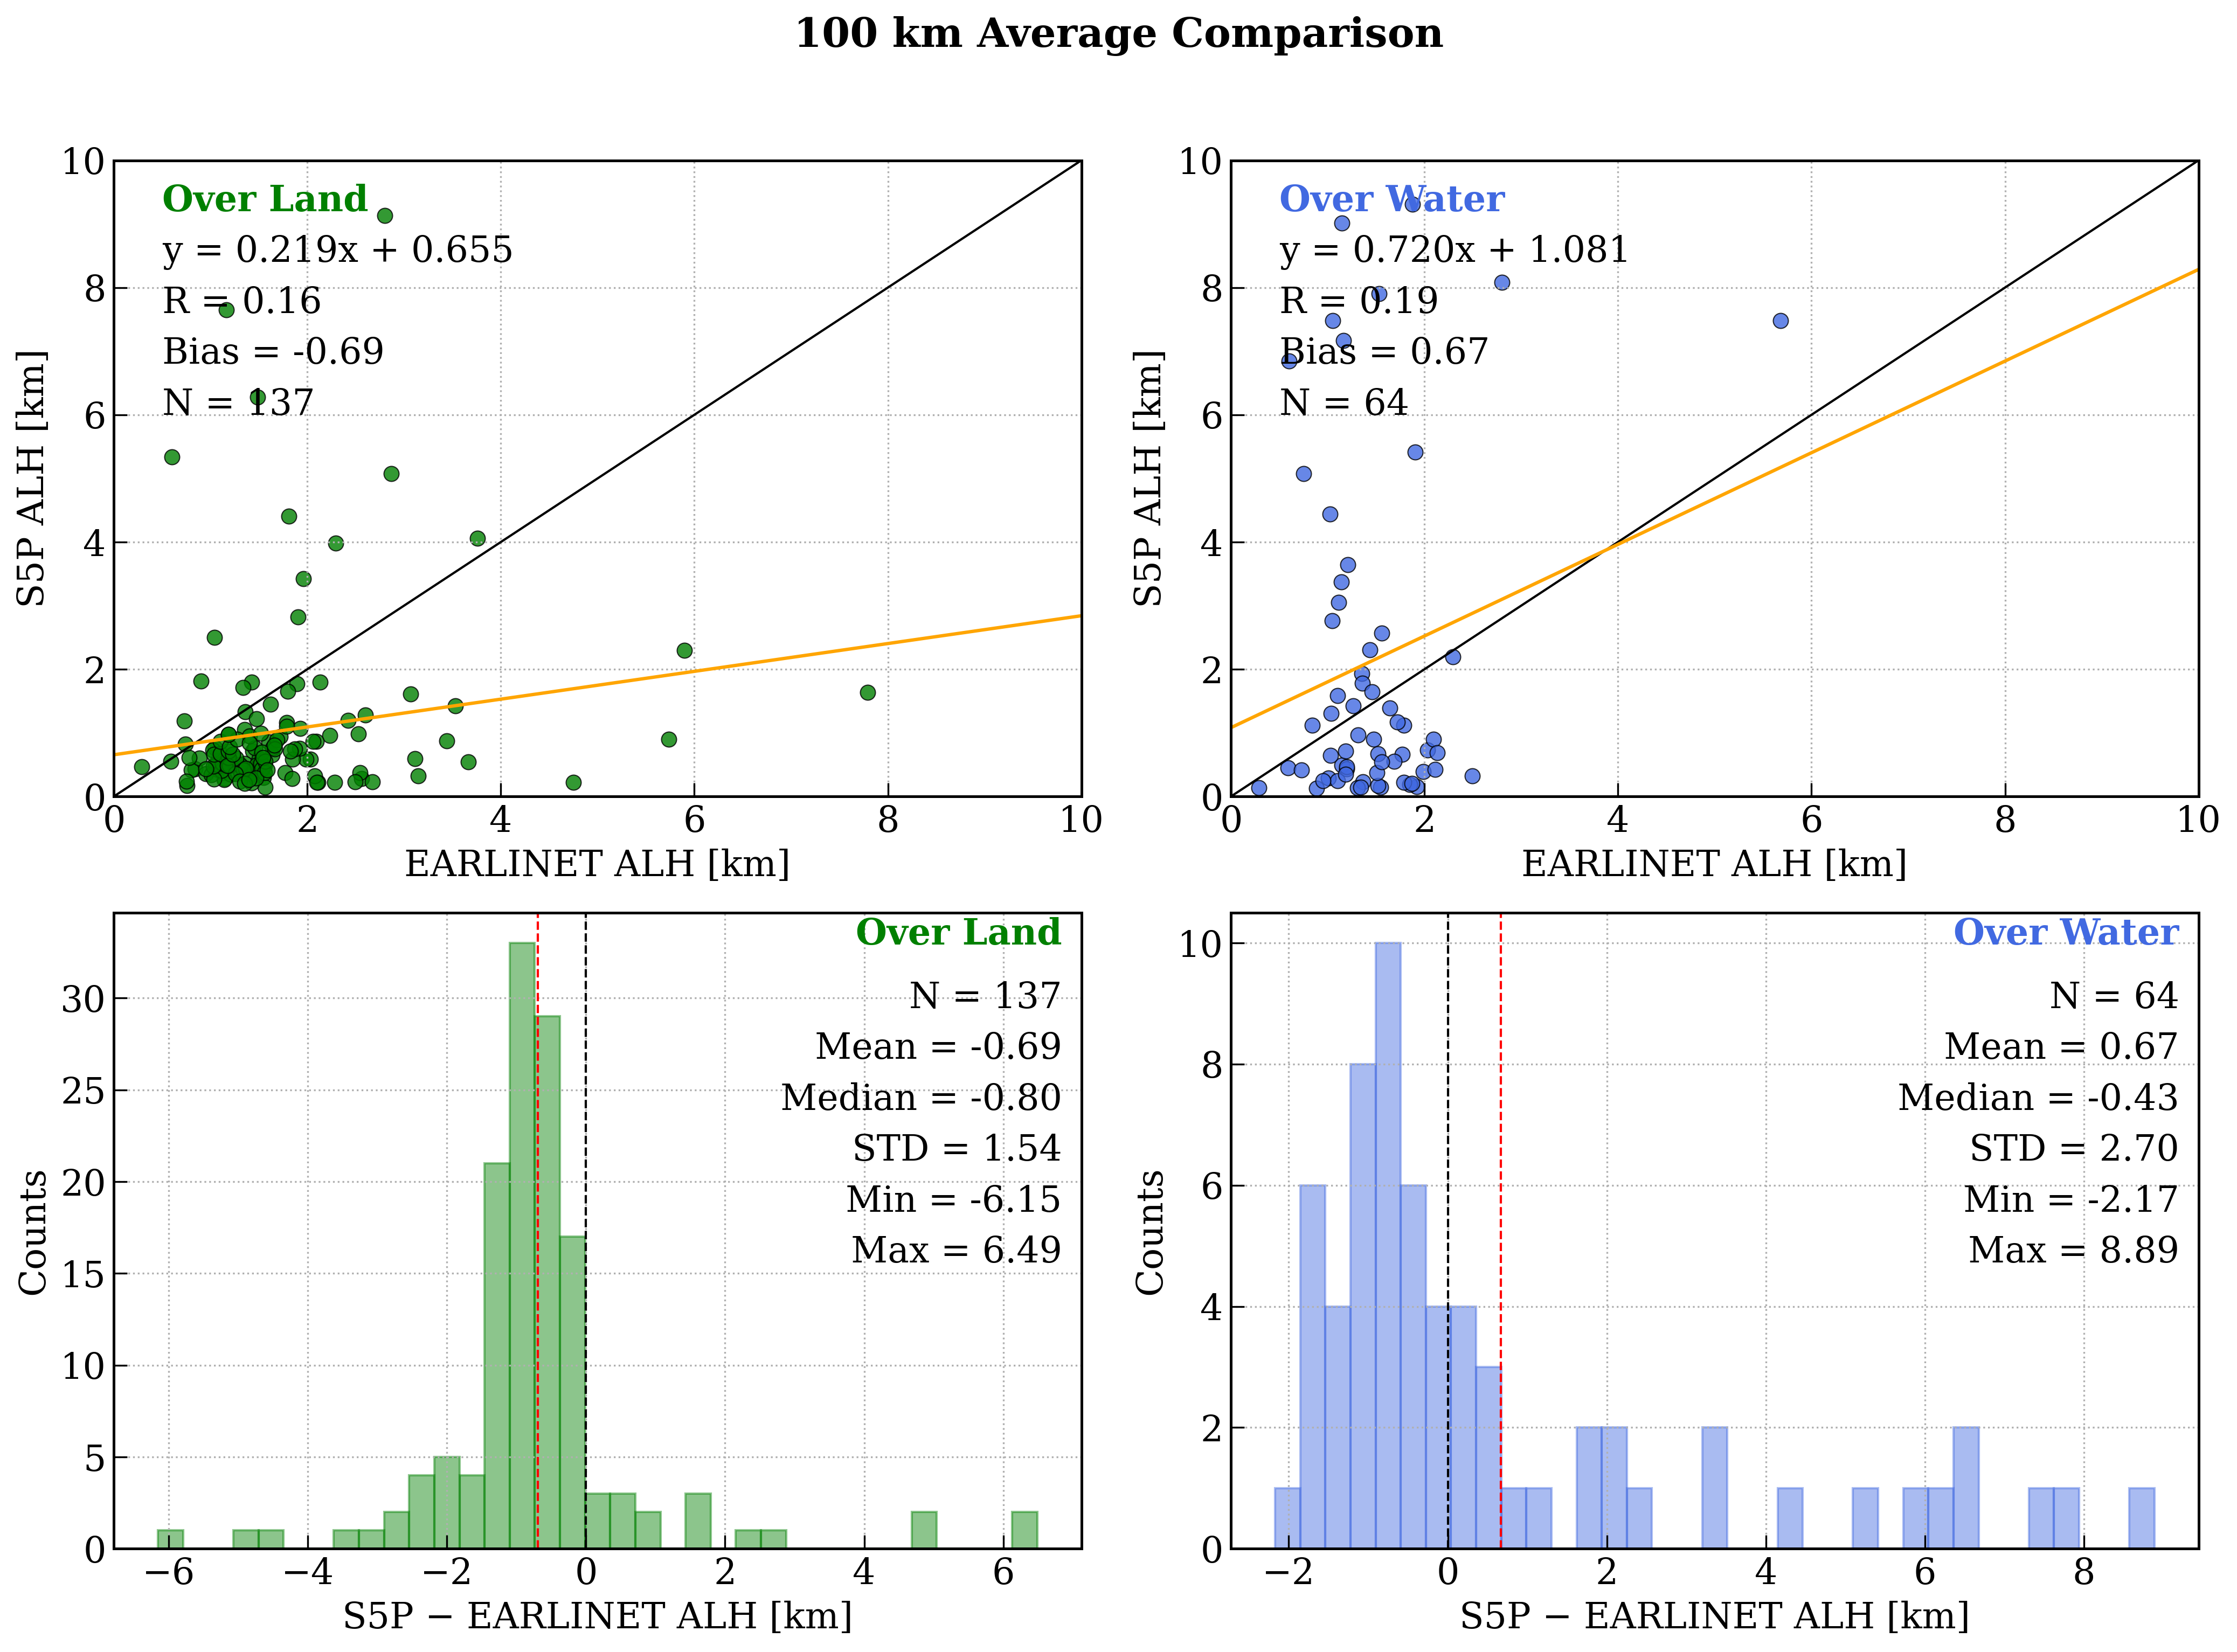
An assessment of the AER_LH algorithm version 02.09.00 has also been performed based on a selected period (December 2025 to May 2026) including EARLINET observations from several stations. Collocated observation pairs within a 100 km radius and a ±3 h temporal window were evaluated to quantify the consistency between TROPOMI and EARLINET datasets and to ensure the most representative TROPOMI–lidar comparison. The figure below summarize the comparison between TROPOMI L2 AER_LH retrievals and EARLINET-derived aerosol layer heights for all collocations identified during the study period, shown separately over land and ocean surfaces. For each figure, the upper panels present scatterplots for land (left) and water (right) pixels, while the lower panels show the corresponding histograms of absolute ALH differences. Statistical metrics for each subset are included directly within the figure panels for clarity.