Page 2 of 7
The graph below shows boxplots of the difference (left) and relative difference (right) between TROPOMI ROCINN_CAL cloud top height and CLOUDNET cloud top height. (© Update June, 2026, of Compernolle et al., AMT 2021).
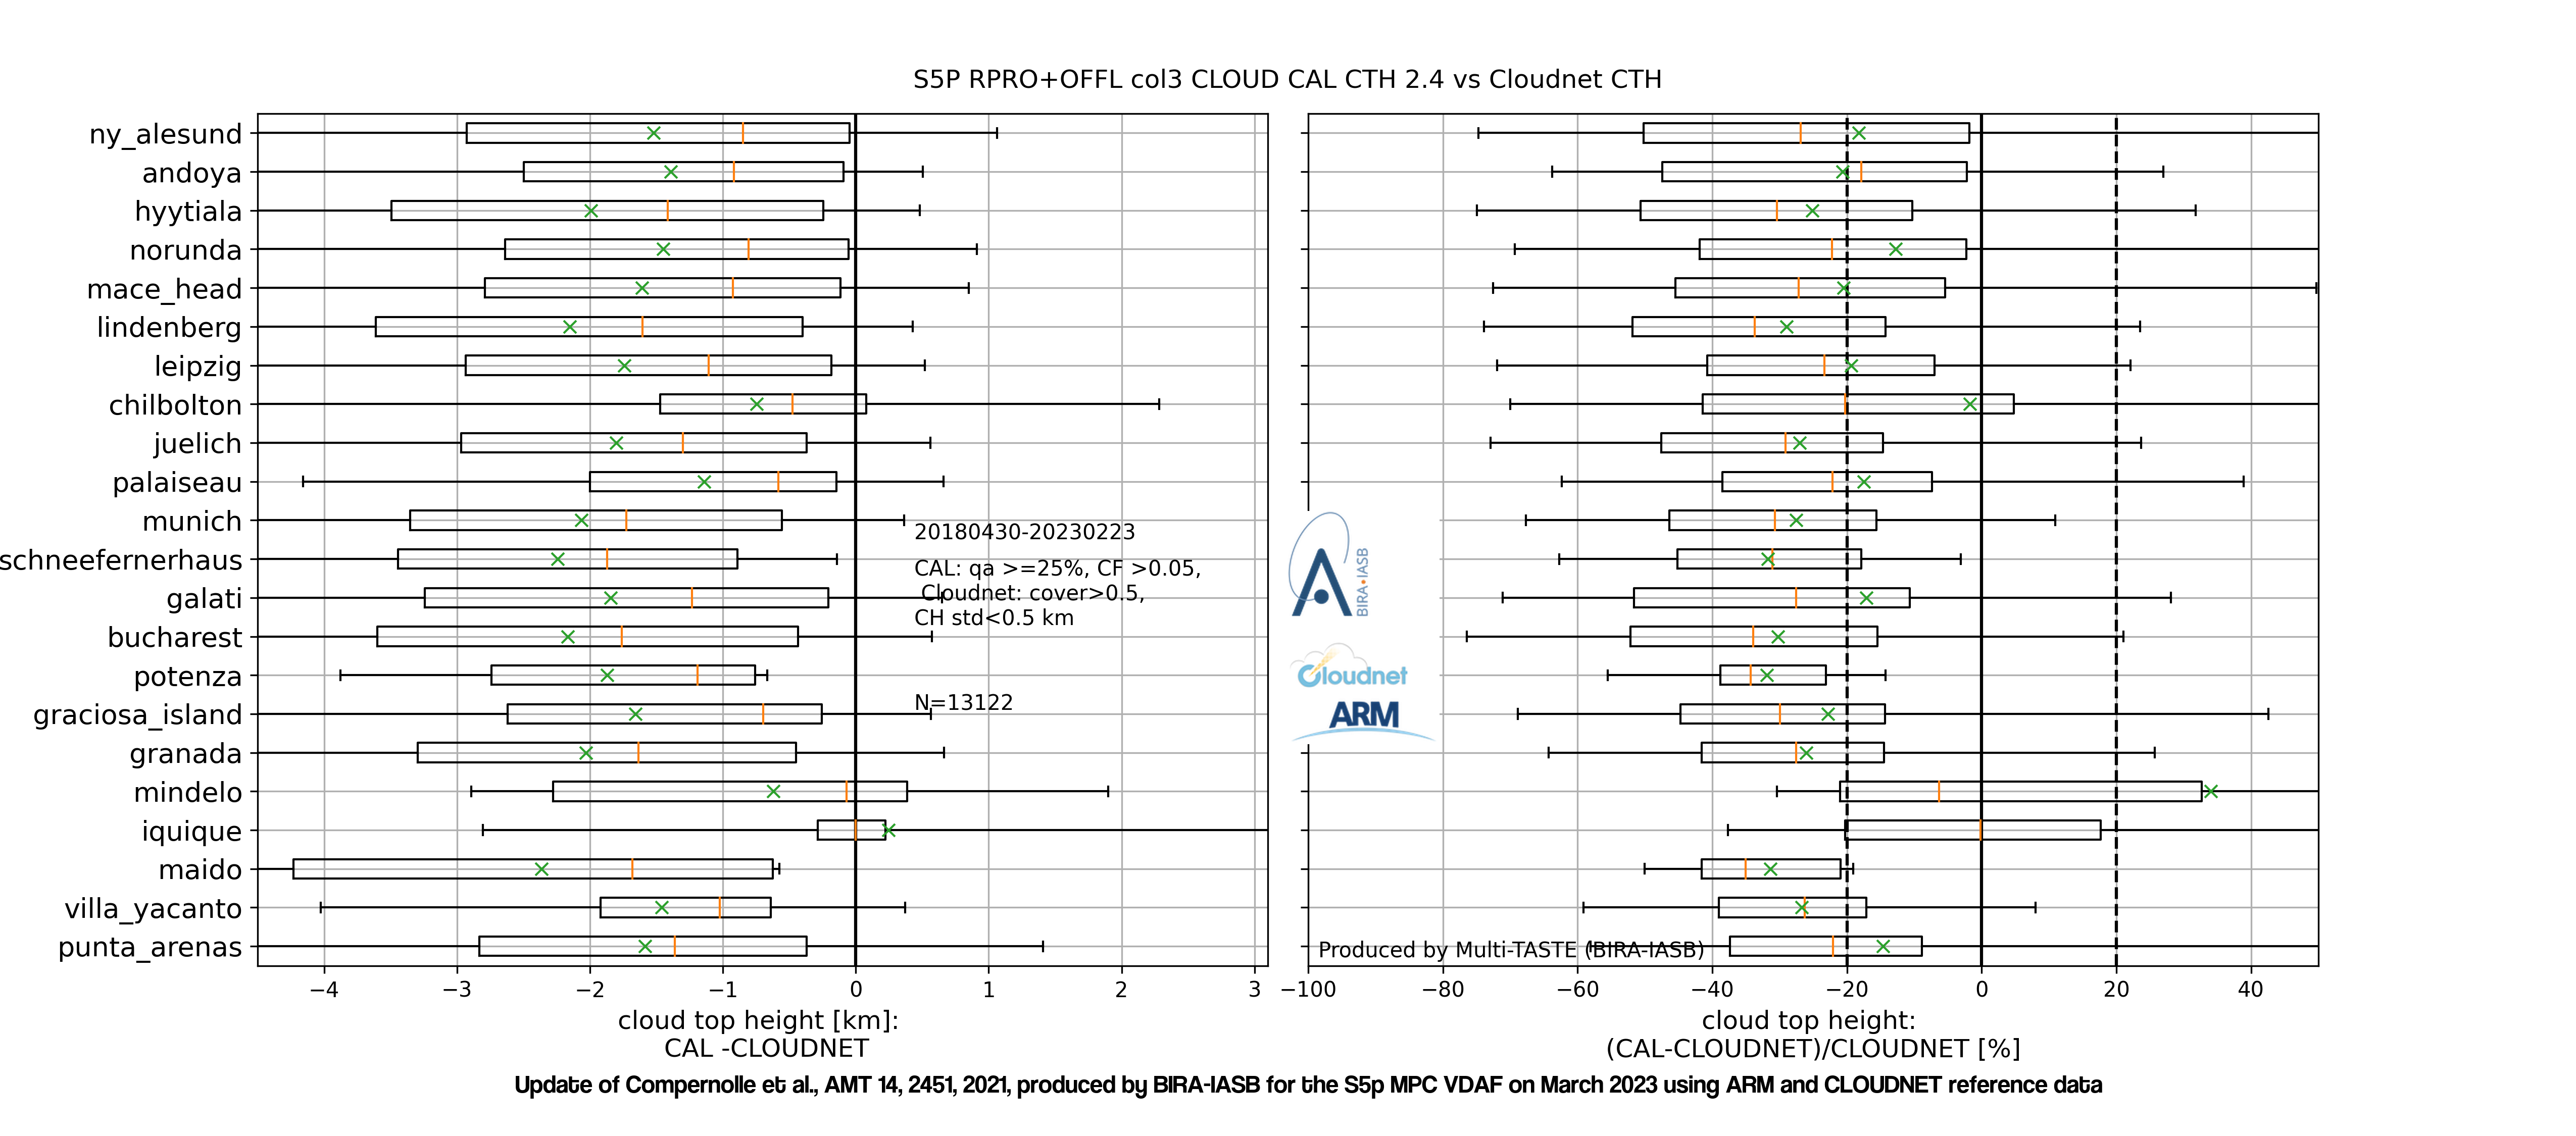
The graph below shows boxplots of the difference (left) and relative difference (right) between TROPOMI ROCINN_CAL cloud top height and CLOUDNET cloud top height. (© Update June, 2026, of Compernolle et al., AMT 2021).